
The logistics processes at PostNL are powered by an extensive event-driven architecture. In the center of this landscape sits the Event Broker e-Commerce (EBE), which allows developers to autonomously register, discover, and consume the events in our landscape. In four blog posts we will explore how we made the EBE observable, allowing us to investigate and understand the dynamic, high-volume traffic flows being processed by the platform.
This is the first in a series of articles. In this post we will describe the context guiding our implementation choices, and the foundations on which we built our observability implementation. The table below will link to the other parts when they are published.
- Part 1: The PostNL context
- Part 2: Generating traces
- Part 3: Processing and sampling
- Part 4: Insights galore!
Introduction
In 2022 PostNL delivered an average of 1.1 million parcels per day (see the annual report). The journey of every parcel is managed by dozens of applications, responsible for sorting, planning, billing, customer communications, reporting, and so on. Together these applications generate and exchange billions of events per day.
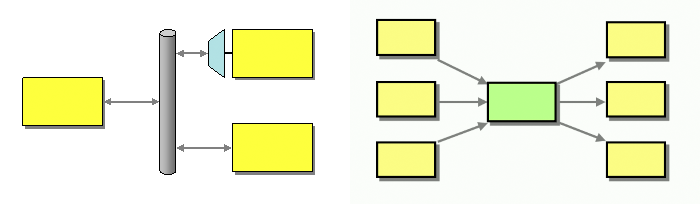
Decades of enterprise architecture experience tell us that directly integrating multiple applications will quickly lead to integration spaghetti (see the chapter Message Broker in Enterprise Integration Patterns). One solution to this problem is to utilize a central message bus, another is the central message broker.
Self-service serverless message broker
PostNL took the message broker concept and added a self-service layer to it. This allows the engineers of our producing and consuming applications to autonomously register, discover, and consume events. They achieve this through an internal website, which applies all the business logic, validation, guardrails and rules required to safely manage our event integrations. This approach has been a great success: every month we see many new event types being registered, new subscriptions being created, and outdated integrations being removed – all without any engineering or configuration effort from the integration team. In effect, the Event Broker e-Commerce (EBE) has become an integration platform. The EBE team builds and maintains the platform, while our users use and configure the platform the way they see fit.
The development team is responsible for adding the functionality our users need. For example, they add support for event protocols like MQTT, HTTPS, SQS, SNS, EventBridge, or Kafka, or they add new user-facing features like reporting or alerting.
The EBE falls under PostNL’s cloud-native mandate, which states that all differentiating applications built by our in-house development teams must be built with AWS cloud-native services, with a strong emphasis on serverless technology. This mandate forces development teams to delegate the most difficult responsibilities of high-volume, mission critical applications to AWS. In case of the EBE, this resulted in a design centered around the core services of Lambda, SQS, and EventBridge. This architecture allows the EBE to effortlessly scale to any workload generated by PostNL’s logistics processes.
Dynamic infrastructure
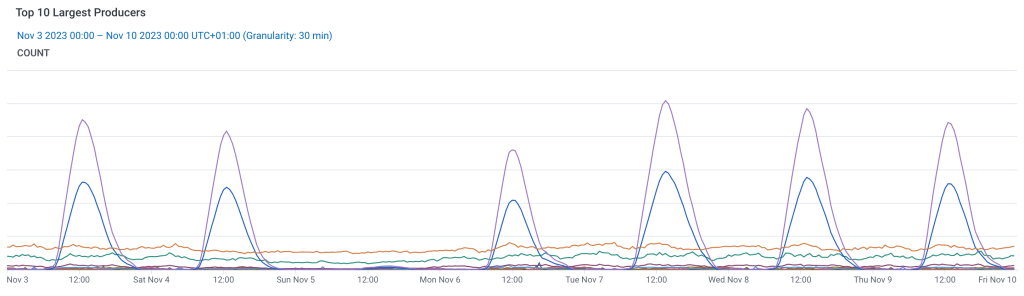
One side effect of the self-service platform approach is that usage of the platform has become unpredictable. On any given day, our users might register a new event type and start to produce a million messages per hour. Or they might create 50 new subscriptions for a new application. Or they might onboard a new team with a dozen developers. We strongly support the autonomy of our users, so we need to design our systems to dynamically adjust to anything thrown at them.
This poses a challenge for the EBE developers. They are responsible for operating the service, but its underlying infrastructure is continuously being used and configured in ways we have never predicted. This requires the ability to understand the system as it is behaving at any given time, and it must allow developers to pinpoint the exact cause of any unexpected behavior. And strange behavior can take very exotic shapes, like “an application that consumes a message on an HTTPS endpoint, which the producer sent to the EBE over SQS, experiences increased latency on Sunday evenings”.
The need for observability
The book Observability Engineering states that “in control theory, observability is defined as a measure of how well internal states of a system can be inferred from knowledge of its external outputs”. It continues: “put simply, our definition of “observability” for software systems is a measure of how well you can understand and explain any state your system can get into, no matter how novel or bizarre”. It’s no surprise that this definition is a perfect description of our needs.
Our conclusion is that the EBE needs to be observable, following the definition of observability stated above. In the rest of this article series we will focus on the ways we achieved this, and the challenges we solved along the way.
Event flow observability
The goal of “understanding and explaining any state your system can get into” is a good starting point. However, the EBE has a few additional observability requirements, specifically aligning to our use case of processing dynamic event flows.
- We want to know the exact details of the events the EBE receives; the source, the protocol, the size, the volume, the patterns, and every other detail of the events the EBE receives.
- We want to know the exact details of the events the EBE sends; their destination URLs, protocols, volumes, response codes, latency, any errors the system encountered, retry and backoff patterns, and every other detail available.
- We want to see and understand the errors in our system; exceptions, stack traces, timeouts, retries, dead-letter queues, and so on.
In summary: we want to be able to understand and explain the exact flow of events through our system. After all, supporting these event flows is our core responsibility.
Choosing OpenTelemetry
When we started our observability journey, we investigated which technologies and platforms would best fit our needs. We looked at AWS X-Ray, CloudWatch, Datadog, New Relic, Splunk, Lumigo, Honeycomb, and a few others. Some were immediately rejected because of cost or compatibility issues. We also tried to avoid the vendor lock-in of custom agents. From the resulting list, one thing stood out: they all supported OpenTelemetry as their telemetry ingestion protocol. This meant that by choosing OpenTelemetry, our observability vendor decision became a two-way door: we could easily and quickly choose a vendor now, and just as easily and quickly change vendors at a later stage if required. In fact, this is a core feature or OpenTelemetry. From their What is OpenTelemetry page:
OpenTelemetry is an Observability framework and toolkit designed to create and manage telemetry data such as traces, metrics, and logs. Crucially, OpenTelemetry is vendor- and tool-agnostic, meaning that it can be used with a broad variety of Observability backends […]
This quickly sealed the deal; the EBE would build its observability implementation on an OpenTelemetry foundation. Another reason we preferred the open format is that it allows for custom processing, sampling, and fan-out patterns. We have used this capability extensively, as we will cover in a later installment of this series.
Conclusion of Serverless OpenTelemetry at scale, part 1: the PostNL context
PostNL has a large event-driven landscape, and the Event Broker e-Commerce (EBE) allows application teams in that landscape to quickly and reliably manage their integrations. The self-service principle enables scale and standardization, but results in complex and dynamic usage patterns. The EBE requires a strong observability foundation to maintain understanding of the platform. We chose OpenTelemetry as our telemetry protocol because of its flexibility, broad adoption and openness.
In part 2 we will look at telemetry generation – span designs, context propagation, semantic conventions and custom instrumentation. Stay tuned!
